Phase and Comb Filtering
Summation is a form of acoustical gambling where relative amplitude sets the stakes and relative phase decides the winner. – Bob McCarthy
Throughout this article, we will talk about what is the phase and how it affects our measurements. These concepts will give us clarity in what position to use our measurement microphone; with these techniques I achieve great results in my measurements.
What is the phase?
The phase is related to time, although we must take into account that it is not the only variable that can modify the phase.
To be more clear about what the phase is about, we must remember that the period (T) is the time it takes a wave to develop a complete cycle of a certain frequency. Mathematically:
T (seconds) = 1s/frequency
oT (milliseconds) = 1000 ms/frequency
It is important to take into account that for the audible frequencies (20 Hz – 20,000 Hz) there is a ratio of 1: 1,000. This means that the period of 20 Hz (50 ms) is one thousand times greater than that of 20,000 Hz (0.05 ms).
Taking these details into account, let’s get into the subject.
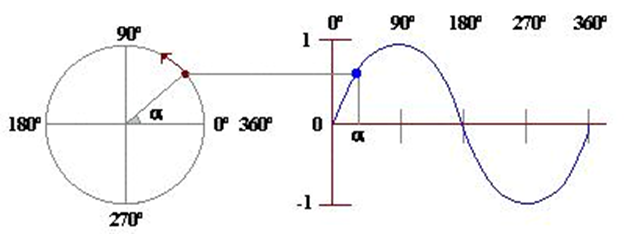
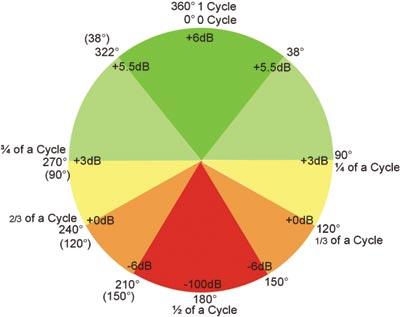
If we think of a sine wave and its resemblance to an “unfolded” circle, we would think that we can express in what position of the sine wave we are by means of degrees. Being 0 ° the beginning of the wave, 90 ° the value of maximum amplitude, 180 ° half wave, 270 ° the minimum amplitude and 360 ° the end of a complete cycle (and the beginning of the next).
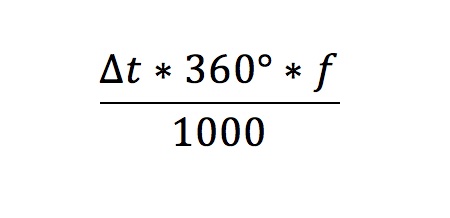
Thinking about this we can associate the phase and the amplitude of a wave to time. Let’s see the following expression.
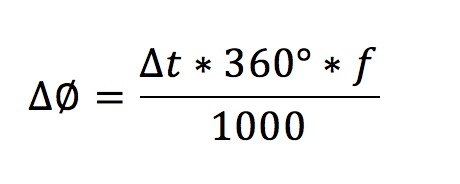
Being:
ΔØ the resulting phase
Δt the time in which the analysis is done (in milliseconds)
f the frequency
Thinking about this mathematical expression we can realize that the phase is directly proportional to the frequency and time elapsed. Let’s make an analysis of what happens to the phase if it passes 1 ms since it starts a signal.
Resulting phase after 1 ms:
100 Hz = 36 °
500 Hz = 180 °
1,000 Hz = 360 °
1,500 Hz = 540 °
2,000 Hz = 720 °
10,000 Hz = 3,600 °
The phase helps us to know how many cycles or fractions of the cycle have passed after a certain time has elapsed. It should be noted that the phase is a characteristic of the waves and it is not necessary that there is more than one signal to be able to analyze it.
What happens when 2 signals interact?
So far we have talked about the phase in a single signal and this does not seem to have many complications, I dare say that many of us do not even remember that the phase exists until we have more than one correlated signal interacting. The phase relationship between two correlated signals determines what will be the result of the sum of said signals.
Let’s do an exercise.
We are going to use 2 tone generators to generate in both 1,000 Hz with an amplitude of 0dB.
We will see in an oscilloscope the signals of the generators and the sum of both signals.
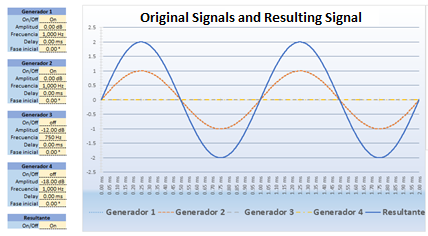
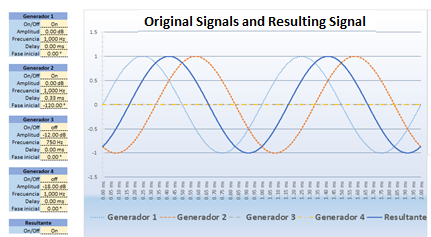
In this image, we can see that both generators have the same amplitude and the same phase. If we look at the “Resultant” curve, which is the sum of both signals, we can notice how the
amplitude has doubled. If we express the result in dBs we would say that:
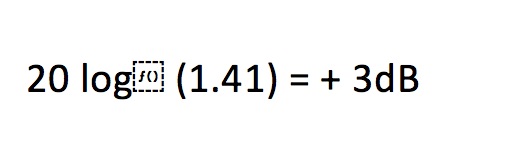
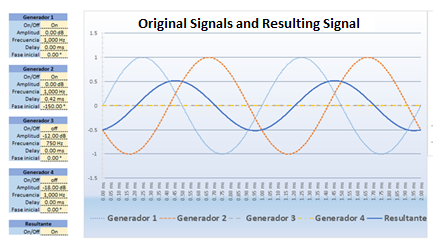
In this image, we can see that there is a phase difference of 90 ° between the signals. If we observe the “Resultant” curve we can notice how the amplitude has only added up to 1.41 and that the phase of the resulting signal has taken the average value between both signals. If we express the result in dBs we would say that:
In this picture, we can see that there is a phase difference of 120 ° between the signals. If we observe the “Resultant” curve we can notice how the amplitude has not added up anything and that the phase of the resulting signal has taken the average value between both signals. If we express the result in dBs we would say that:

In this image, we can see that there is a phase difference of 150 ° between the signals. If we observe the “Resultant” curve we can notice how the amplitude has been attenuated up to 0.5 and that the phase of the resulting signal has taken the average value between both signals. If we express the result in dBs we would say that:
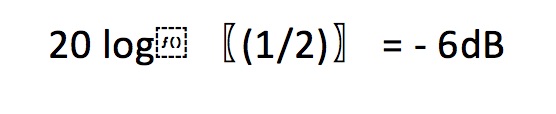
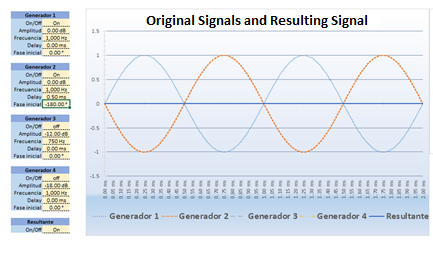
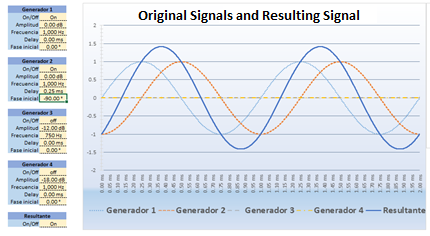
In this image, we can see that there is a 180 ° phase difference between the signals. If we look at the “Resultant” curve we can notice how the amplitude has been canceled completely. If we express the result in dBs we would say that:
From all this, we can conclude that the sum of 2 correlated signals is closely linked to the phase relationship between the two signals. This behavior is summarized in the following equation.
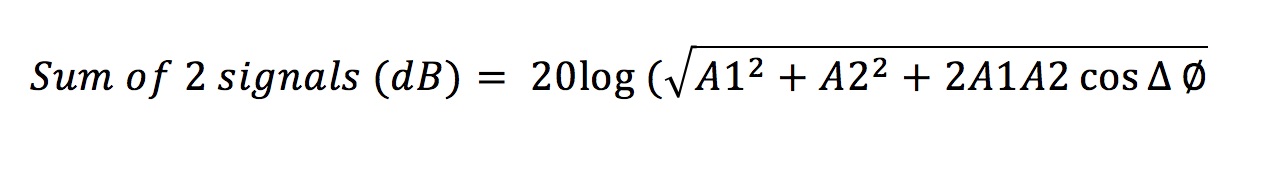
Where:
A1 = Amplitude of signal 1
A2 = Amplitude of signal 2
Δ∅ = Phase difference between signals
And it is visually summarized in the phase circle.
The comb filter
In the previous exercises, we understood how the phase determines whether there is a sum or cancellation when adding 2 signals, but we must take into account that in these exercises we work only with sinusoidal tones, that is, a single frequency. The reality is that we do not work with sinusoidal tones, now we must analyze what happens with full-spectrum signals.
Let’s see the following example:
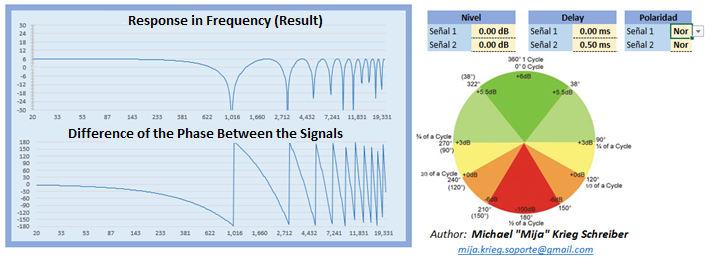
In this image, we can see the sum of 2 full-spectrum signals. These signals have a time difference of 0.5 ms, which is the period of 2,000 Hz. We know that this difference in time will affect each frequency differently, let’s see some examples:
Δ∅ @ 500 Hz = 90 ° (+ sum 3dB).
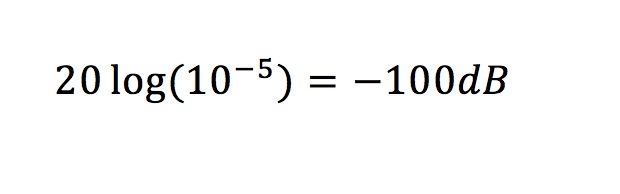
Δ∅ @ 1,000 Hz = 180 ° (-100dB attenuation).
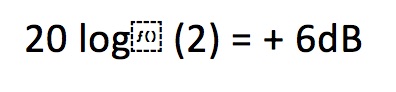
Δ∅ @ 2,000 Hz = 360 ° (+ 6dB of sum).
Δ∅ @ 3,000 Hz = 540 ° (-100dB attenuation).
Δ∅ @ 4,000 Hz = 720 ° (+ 6dB sum).
This phenomenon is known as the comb filter, named for the similarity of the graphic to a comb.
How does the comb filter affect our measurements?
We know that the comb filter is the result of adding 2 signals correlated with time differences. When we perform measurements in the field there are many possible causes of the comb filter, one of these causes are reflections.
We can imagine the reflections as a ghost image of the original signal but delayed in time. The reflected signal travels longer, this is what causes the delay.
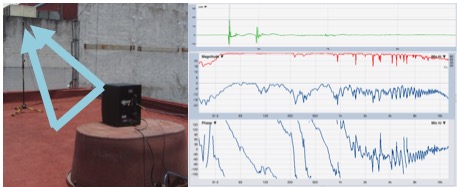
Let’s see this example done with the MM1 measuring microphone from Beyerdynamic and a full-range speaker.
In this image, we can see how the direct signal and the reflected signal reach the microphone with a time difference. By means of the impulsive response, we can find out that the time difference is 1.67 ms, which is the 600 Hz period. Let’s see what happens in some frequencies when adding 1.67 ms of difference.
Δ∅ @ 300 Hz = 180 ° (cancellation)
Δ∅ @ 600 Hz = 360 ° (sum)
Δ∅ @ 900 Hz = 540 ° (cancellation)
Etc…
How can we decrease the comb filter in the reflection?
It is already clear that the comb filter is caused by the time difference between both signals, if we want to eliminate the comb filter we could:
- Eliminate the reflection, we could achieve that by removing the floor or giving it acoustic treatment. This option is not possible.
- Minimizing the time difference, we could achieve this by decreasing the difference in the path of the reflected signal with respect to the direct signal.
In this image, we can see how we have managed to improve our measurement by just placing the microphone on the floor. These measurements are known as “Ground Plane”.
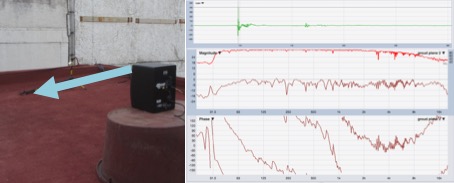
This measurement does not eliminate reflection, instead, we have come so close to the reflection that we can not see the time difference between it and the original signal.
These types of measurements are very helpful when we work in places with very reflective surfaces, allowing us to focus on what the speaker system is really doing. Of course, a person standing sure noticing the presence of the comb filter, but when the room is full of people the same coefficient of sound absorption of the spectators will prevent the reflection can cause comb filters.
Questions:
What does the phase indicate?
The advance or position of a sine wave expressed in degrees
The time difference between 2 speakers
The period of a signal
The polarity of a signal
What is the result of adding 2 tones with the same amplitude but a phase difference of 90°?
+ 3dB
+ 6dB
0dB
-3dB
What is the result of adding 2 tones with the same amplitude but a phase difference of 180 °?
0dB
-6dB
-100dB
You can not know
What is the comb filter?
It is the induction caused by not properly ¨combing the wires¨
It is the result of adding 2 signals correlated with a time difference
It is the result of adding 2 signals not correlated with a time difference
It is the result of adding 2 signals correlated with a reversal of polarity
What are the “Ground Plane” measurements?
In reducing the time difference between the direct signal and the reflected signal in a measurement.
It is about the measurement of the noise that the ants captured during the show.
Remove reflections from the measurement
Reduce the interference caused by the wind
 Michael “Mija” Krieg Schreiber
After obtaining an Audio Technician degree in 2010, with a major in live audio, he took a series of courses related to the subject, such as the use of Smaart software, line arrays, the design of reinforcement systems sound, SIM3, processors of open architecture, among many others.
He has worked in various companies, productions, and clubs. He has done installations as an instructor, designer, technician and operator of sound systems, bringing together 9 years of experience to date. Among the companies, productions and venues with which he has worked are Audio Representations, Meyer Sound Mexico, Hi-tech Audio, Papal Mass in San Cristóbal de las Casas 2016, Corona Capital 2014, National Auditorium, Arena Mexico City, among others.
Nowadays he concentrates his career in educational activities offering different presentations and professional audio courses. Among the schools and organizations with which he has collaborated are: Avixa, AES Mexico, National Polytechnic Institute, Technological Institute and Superior Studies of Monterrey, UNITEC Technological University of Mexico, SAE INSTITUTE Mexico, EMEH School of Music of the State of Hidalgo, G Martell, Pro Audio Puebla, among others.